Speed Up Your PDF to Excel Conversion With Custom Excel Templates

Excel Spreadsheet Diagram

When working to convert PDF data into Excel, you can be swamped with the repetitive task of converting the same data everyday.

For handling large groups of PDFs, there’s the batch conversion feature in Able2Extract. Yet, this option is only ideal for full and automatic conversions.

What about multiple PDF to Excel conversions that need a bit of customization or scanned PDFs that can’t be converted in batch mode, but have the same layout per page?

Continue reading →

4 Simple Ways Budding Project Managers Can Start Creating Gantt Charts

Organized Project Planning When remote teams are becoming more and more common, it isn’t surprising to see project managers struggling to stay on top of things. One project involving a number of tasks with just as many people working on it can spin out of control.  You’re not only working with people, but you’re also working against time and resources.

And this is where a Gantt chart steps in. If you aren’t using one as a budding project manager, you may want to. Gantt charts are an essential tool to project management. They keep a detailed track record of a project’s critical path at any given moment.

It keeps you up to speed on important factors like the progress or status of a task. Interdependent tasks and resources can be allocated, visualized, and coordinated. And with the internet and your everyday computer, Gantt charts can be updated as needed.

But technology needs and personal preferences are diverse. We know there are many other simpler, quick fix tools that can be used to manage projects to varying degrees. Looking to step things up? Need more complex features?

Whether you’re stepping into a project mid-stream or need to consolidate your project calendar with an existing one, there are ways you can integrate existing tracking sheet and schedule data into a Gantt chart.

1. Convert Google Calendar, Base Camp & Trello Into A Gantt Chart

Now Google Calendar, Base Camp or Trello are probably the most popular free tools online. They’re easy to set up, offer the basic project tracking essentials and can quickly get you started.

Google Calendar, as a project planning tool, needs no explanation.  Basecamp, known for its highly collaborative nature and tracking features, is a popular go to option for managing teams. And Trello is a web app that uses individual (and collaborative) task cards grouped into boards in lieu of a To-do list.

So if you need to suddenly create professional-looking tracking reports or share your calendar with others, great news is that you can create a Gantt chart from all 3 tools using Ganttify.

Gantt Chart Creation Webapp

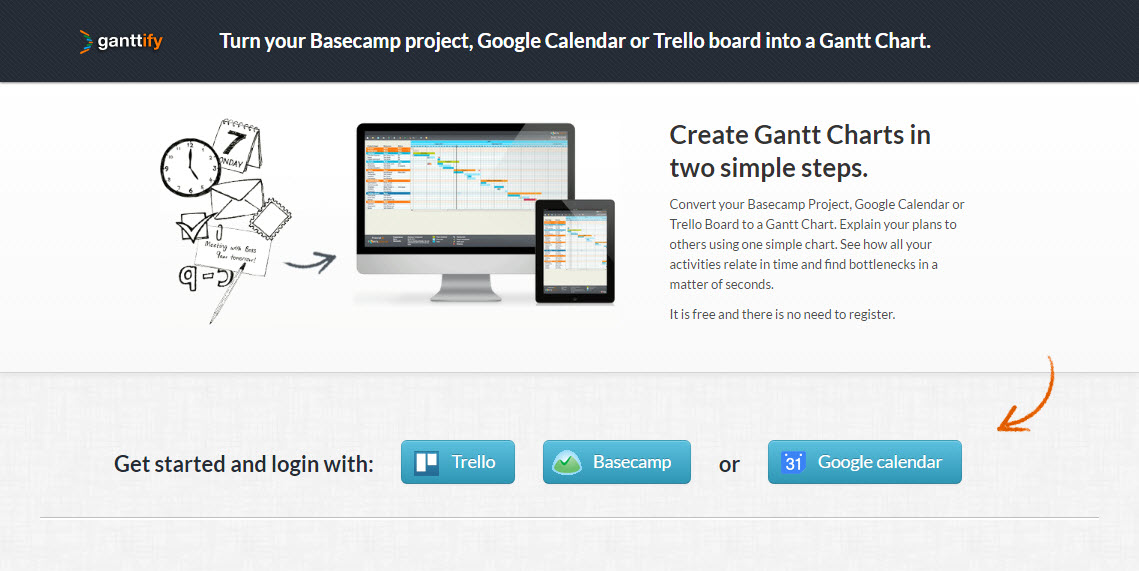
Ganttify is a webtool that does what it sounds—it takes your data and “Ganttif-ies” it without having to do much but log into your accounts (note that with Trello, though, your task cards need to have a start and end date included).

2. Create Gantt Charts In Microsoft Excel

If you’re just starting out on managing your first project, chances are you’ll turn to familiar tools like Excel where you’ll construct your own tracking sheet with basic formatting and formulas. However, don’t be afraid to get a little more complex and use Excel to create a Gantt chart.

Officetimeline.com, for instance, offers up a detailed, step-by-step tutorial manual on how to create a Gantt chart Microsoft Excel users can set up. Note, that creating one from the beginning can be time consuming, but as your projects become more complex, you’ll be glad you invested the time.

For those who don’t want to create things from scratch, though, you can still get the job done by using a Gantt chart template.  You can find a variety of them online. Here are a few to start you off:

  • A simple 4 week project timeline Excel template from Office.com
  • A free version of Gantt Chart Template Pro from Excel expert, Jon Wittwer, at Vertex42.com
  • GanttExcel.com also has a template you can download that has both a paid and free version
  • Chandoo.org offers a variety of Gantt chart templates for project management

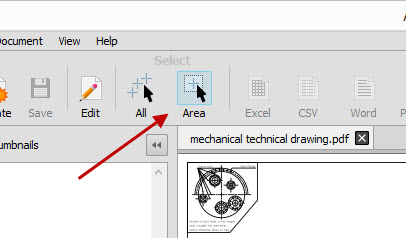
3. Import Excel Data Into Microsoft Project 

For a more specialized project management tool, Microsoft created MS Project. While part of the popular MS Office suite, the project management software program isn’t included with the desktop suite.

This program offers the high end features that are needed for more multi-level complex projects that need high level monitoring and workflow analysis, cost calculations, in-depth planning, enterprise-wide access and more.

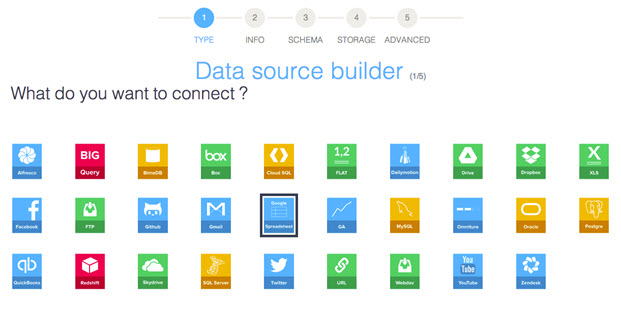
However, if you started tracking your project with MS Excel and are switching over to MS Project, there’s good news. You can simply import Excel into Microsoft Project. When you create a new project, choose to create one from Excel. From there, the MS Project import wizard will guide you through the rest.

4. Create A Gantt Chart Online

Online project management is common nowadays. And with cloud storage and remote teams, being able to take and keep things online is essential.

It isn’t any wonder that you can create Gantt charts online free from the very beginning, making it easily accessible from wherever you or your team are. Though you get what you get with online versions, the essential features are there.

Ganttic.com is an online resource planning, scheduling and management tool. While paid accounts will provide you with more features, for project managers that are bootstrapping it, there’s a limited free account available. It allows you only 10 resources to track. but despite the limitation, Ganttic.com has features that are streamlined and simplified.

Ganttic Introduction from Ganttic on Vimeo

Second is Gantter.com which is a free cloud-based project management tool. This one sticks out because it works tightly with Google Apps and Google Drive, which, if you’re working with a Google based team, is perfect.

Its features leverage the power of Google’s cloud services, including real time editing, chat, and Google Drive access. You can even import and export files from Microsoft Project. Not a Google user, though? Don’t worry.  Gantter.com offers a smartapp.com edition that ties in other cloud drives you may be using.

How are you keeping track of your project and your team? If you know of any other Gantt Chart tips to expand on this list, let us know in the comments.

How To Work Excel Like An Accountant Without The Degree

Calculating Taxes In Excel

Not everyone has the skills of an accountant or financial analyst. But if the stress of tax season has taught us anything it’s that we could certainly take our cue from them and handle our finances better than we currently are.

Knowing even a tenth of how to use Excel is an extremely valuable asset to have. From organizational purposes to simple data visualizations, the uses of Excel are unlimited.

We’ve already showed you how to work with your data in Excel with a few basic tips. So we thought it’d be a good time to take things up a notch.

If you want to improve your data analyzing chops, we found some advice, MS Excel resources, and tips to help you to start working with Excel like an accountant without the degree!

Use Excel With A Specific Goal In Mind

There are many things an accountant can use Excel for. A cost accountant could open up a spreadsheet, for instance, to gain some insight from data in a PivotTable. But for you, your situation may be different. You may use Excel for. . . .

What would be your financial reason to learn MS Excel? Answer this question and you’ll be driven to master the program and take the next steps.

Keep Information Organized & Accessible

Although Excel is powerful calculation tool, you have to admit that it’s a great organizational tool. And this is where you can get your feet wet.

You can use it to track and organize almost anything. And for accountants that is key. But if you’re not analyzing corporate invoices, don’t worry. You can still use it in your everyday life.  Use it to keep wedding plans in order, keep track of your monthly budget, or keep your online research. It’s up to you.

Another simple way accountants use Excel? As a means of transparency, giving their clients access to their data and vice versa. You can imagine how this would help if you need to export your data to and from different sources and people.  So no matter what your goal is, learning how to work collaboratively by sharing your Excel workbook with others is another good start.

Know Your MS Excel Basics

If you don’t have any experience with numerical analysis, you’ll need to start from the beginning.  Learn the basics of Excel–and learn them well!

On Quora, a wide range of accountants and financial professionals naturally have differing opinions on which Excel skills are the most valuable for finance and accounting. But what’s generally understood without saying is that basic Excel skills and knowledge are required.

Thus, once you know your way around Excel (simple formatting, data entry), you can start in on features for working with your data. Think MS Excel Pivot Tables, Remove Duplicates, and Text-To-Columns. The aim of this step is to go from not knowing anything about Excel to knowing how to use it for basic calculations.

Get Serious About Excel

This step includes learning about trends like Excel’s impact on Business Intelligence.  It also means trying to get more precise with your Excel spreadsheets and data analysis. To do so, you need to know where to go.

If you’re at a loss at how to start in on seriously and actively learning about Excel, a few Quora professionals outlined what they thought was the best way to learn Excel.  So take a look at the thread. From online resources and courses to certifications and Excel oriented events, there’s no limit on how far you can go.

Use MS Excel Keyboard Shortcuts

Another suggestion to boost your learning is to use keyboard shortcuts for the basics. This is because once you master a skill, you should make it as efficient as possible. You’ll have bigger tasks to perform once you have the basics down. And wasting your time on  the smaller things can slow you down.

Keyboard Law Technology

Pakaccountants.com outlines the kind of MS Excel keyboard shortcuts accountants use. And it’s a powerful list when you consider how much they accomplish. For other keyboard shortcuts, you can access Microsoft’s official list of Excel keyboard shortcuts on their site.

Use MS Excel Cheatsheets

If you can’t remember all the functions and formulas there are, don’t worry. It’s doubtful that even power users can remember them all.  For this, you can simply print up and use an Excel cheatsheet and refer to it when needed. So even if you don’t know which function or formula you need, you’re more than capable of looking it up.

Just Dive In

There is absolutely no substitute for hands-on experience. If you’re going to learn Excel, learn it! Spend time with the program. Many are intimidated by it. But the key to overcoming that is to start understanding MS Excel. So explore it. Test it out. Just dive in.

And if your own personal motivation isn’t enough, another great reason to learn Excel? There are jobs that pay extremely well for MS Excel skills.  It’s nothing but a win-win situation when you learn Excel.  So step up your game and see how far you can go!

6 Online Dashboards To Present Your Google Sheets Data

Excel Spreadsheet Diagram

When it’s more and more common for teams to collaborate around data in Google Sheets, you’ll find yourself needing a way to work with and access that data whenever you need to–not whenever your data analyst gets a chance.

But the problem is that if you aren’t too savvy with MS Excel, putting together your own dashboard for your Google Sheets data is  downright overwhelming.  It can be a steep learning curve you neither have the time nor the patience for.  

As businesses are analyzing data that’s more complex than ever before, vendors specializing in data and business intelligence tools are offering out-of-the-box, online tools to make it easier.

These type of online dashboards can be the perfect solution. They let you get the same professional data visualization and analysis without all the technicalities.

The following 6 dashboard tools, for instance, have simple to use interfaces, features and data connection widgets that can integrate your Google Sheets data. Check them out.

1. Geckoboard

Geckoboard starts our list with its free account option. Powerful enough for Salesforce data and simple enough to use with Google sheets data.  You can set it up as you would upload a file. It’s just a matter of creating a connection to your Google account or linking to the file via URL as a data source. You can find a good run down of Geckoboard’s spreadsheets integration on the site.

2.VizyDrop   

VizyDrop is a data visualization tool that can easily integrate your Google Sheets data. Features with this tool include chart sharing, a dashboard editor, updated data visualizations, the ability to work with custom sources, and built-in app connectors.

This tool is on the simplistic side, but it’s free to use. You can start dropping in your data in their demo space, but you’ll have to sign up to save your data.

3. Slemma

Slemma also makes things super easy for you with its built-in integration with Google Drive available for all types of accounts. This dashboard tool provides you with automatic update and scheduled report delivery features.

Other features include one-click integration, calculations, automated pivot tables, and email dashboards. And if you’re new to working with data and aren’t sure how to best visualize it, you can get some inspiration from the data visualizations and dashboards other Slemma members have done. There’s a free 14-day trial available to check out.

4. BIME Analytics

Connecting Data BIME AnalyticsSource:  BIME Analytics

You can connect a number of any data sources you have with BIME Analytics–including online cloud services like Google Drive.  BIME Analytics allows you to pull data from Google Sheets and cache datasets. There’s no storage; analysis is always live and direct.  You can test it out with a 10 day free trial from the site.

5. Cyfe

In addition to other integrations to third party services like Google Analytics, Cyfe can also integrate your Google Sheets data directly. You have the ability to archive data, export reports, and share your dashboards.  Its widgets will allow you to connect any of your data that’s on the web. You can sign up for free or go with the premium account for $19 /month.

6. Datahero

This tool touts itself as the “fastest and easiest way to understand your data”. DataHero is a data visualization tool that works with the data you already use in cloud storage services, or in files on your computer. 

Import your data from cloud services, create insightful charts and organize them in separate dashboards to get the most out of your data.  Once you sign up you get free trial access to their Premium service, which is a good starting point for exploring your dashboard needs. As a bonus, there is also a free account which will do just fine for visualizing your data on a lower scale.


Marrying business intelligence and Google Sheets data doesn’t have to be complicated or something you dread. On the contrary, it can be as simple as uploading your data online. See if any of the above are a good fit for your data needs.

How To Export A Table From PDF AutoCAD Drawing Into Excel?

Part 2 of 13 in our How To Use AutoCAD series

Working with PDF documents is difficult. Just working with the data itself can be time consuming. This is especially true when you need to extract something as precise as a PDF table into Excel. It requires that data to be transferred, cell by cell correctly into a spreadsheet, formatted perfectly and faithfully to the original.

So you can imagine how exporting a table from a PDF drawing to Excel is somewhat more complicated than exporting a table straight from AutoCAD to Excel.

However, this can be easily accomplished with Able2Extract’s “Custom PDF to Excel” conversion feature.

You can download the 7 day free trial and follow the steps below to export your table.

1.Open your PDF drawing with Able2Extract.

2. In the select panel, click on “Area”. Left click and drag to mark the table that you would like to export.

Selecting PDF Drawing Content

3. Once selected, click on “Excel”.

4. You’ll be presented with a Convert to Excel panel. Export simple tables automatically by clicking “Convert”. For now, stick to the Custom conversion and hit “Define”.

PDF Drawing Table Conversion

5. Now you have a complete control over your PDF to Excel conversion. Use the toolbar on the right to add and remove output columns and rows. When satisfied, check the “Show Preview” box to review your results.

6. Click “Convert” and save the file.

PDF To Excel Results

Converting AutoCAD tables to Excel may sound like a complicated procedure at first, but with the right tool, you can easily maneuver around that obstacle and work with any AutoCAD tables you come across.