There’s a lot of hype around big data these days. And it isn’t any wonder with everything going digital. We’ve been generating a large mass amount of data that’s becoming more and more valuable.
Think of publicly available and open data. You may be asking why is it so important? Using open or publicly available data can be extremely useful. Some examples include:
- Analyzing global trends
- Measuring the efficiency of government policies
- Innovating a new service
- Improving your company’s products
Because of the wide range of applications, not just data scientists, but journalists, marketers, business professionals, and even freelancers, are learning how to access, clean and interpret raw data.
While you may already have access to data analytics tools or a topic to research, all that may be missing are the big data sources to work with. Wondering where to find statistical data? Below is a list of databases you can start with.
1. The World Factbook –The CIA website has an open source library where you can find its World Factbook, which offers the public opendata on 267 countries on topics ranging from history and government to geography and military.
2. Amazon Web Services —Amazon Web Services offers a suite of cloud computing services for database, computing, storage and analytic solutions to name a few. AWS also hosts a number of public datasets, which you can access. You will need to have an AWS account or access to its command line tools.
3. Open Government Data—Looking for data from major governments? You can search through data available publicly from the Governments of Canada, the USA and the UK. The official portal for European data – data.europa.eu – can give you access to a range of data produced by member countries of the European Union.
4. Open Data Network – The Open Data Network, launched by Socrata.com in 2014, is an online data catalogue that makes finding the data you need as easy and familiar as finding data with Google. Its latest enhancements include updates for elements like autosuggestion and easier mobile navigation. This site covers all major US regions including public data sources for areas like finance, health, infrastructure, education and social services to name a few.
5. Google Public Data Explorer– What better place to explore datasets than on Google? Google Public Data Explorer makes it easy for anyone to access and interact with public data from international organizations and academic institutions. You can upload, share and visualize datasets. Here’s an overview to get an idea of how to use Google Public Data Explorer.
6. DBpedia — DBpedia is a crowd-sourced effort to pull structured data from Wikipedia into an accessible database form on the web. According to the site, the advantages of the DBpedia knowledgebase are that “it covers many domains; it represents real community agreement; it automatically evolves as Wikipedia changes, and it is truly multilingual.”
7. Worldbank.org—Made up of five international organizations, the World Bank Group is the largest development bank in the world, working towards ending poverty and shared prosperity. The organization offers “free and open access to data about development in countries around the globe.”
8. UNData—UNData is an internet based data service from which you can access datasets that include statistics from countries that are part of the United Nations.
9. World Census Open Data—Need census data from other countries? Get census results from other places around the globe like Argentina, New Zealand, Romania, and Egypt. This source is valuable for those gathering geographical or localized statistics. In addition, you can find census data for the USA and Statistics Canada in the linked sources for easy access.
10. Open Data Portals –At Dataportals.org you can find a curated list of open data resource portals around the world. It will help you start broadly and then narrow down your search by location. With 519 portals, as of this writing, the site welcomes additions or feedback to create one of the most widely curated free public data sources online that every user can benefit from.
Dealing with datasets can get overwhelming. You can expect your data to be disorganized and unruly. And as easy as these sites are to visit, be warned that you may come across hard to access formats requiring you to first convert a scanned PDF to Word before being able to use it. But don’t get discouraged. The potential of that data is unlimited.
Did we miss any? Add your own main sources to this collection—the more on this list, the better!


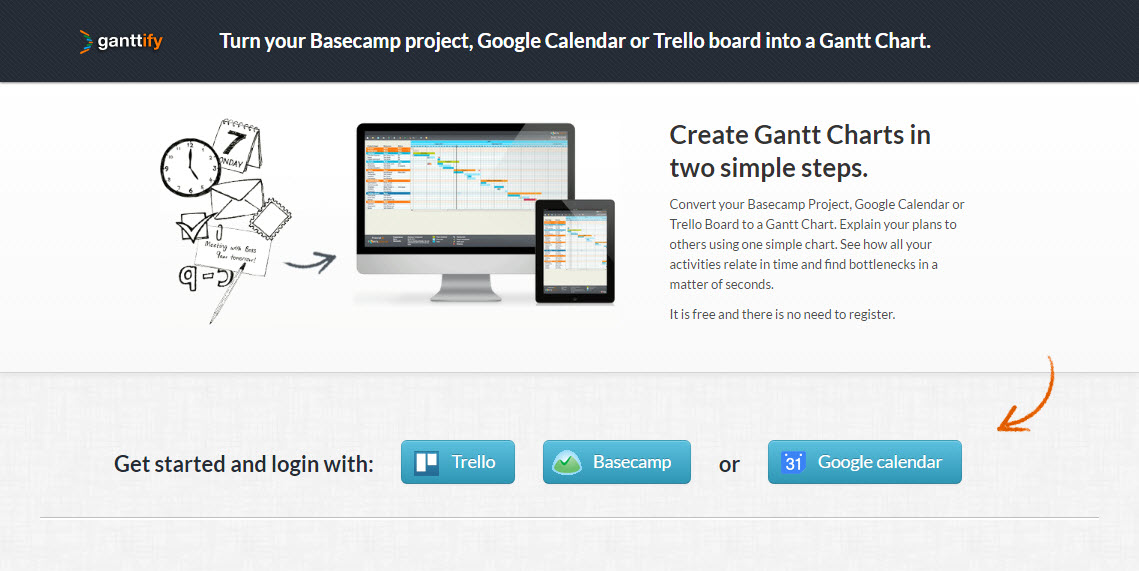
 When remote teams are becoming more and more common, it isn’t surprising to see project managers struggling to stay on top of things. One project involving a number of tasks with just as many people working on it can spin out of control. You’re not only working with people, but you’re also working against time and resources.