Year-end offer: Save 50% on Able2Extract Professional single license purchases before December 31!

How To Create A PDF Portfolio From Your Instagram Photos

Viewing Instagram On Laptop

Instagram selfies are all the rage these days. The app has helped users (and celebrities) produce some of the most widely shared pictures on the web.

Who doesn’t like to take a fun pic when they’re out and about or when a memorable family moment crops up?

Yet for some, Instagram is a professional tool. From graphic designers and photographers to online entrepreneurs and real estate agents, Instagram is an extremely effective platform for marketing and spreading the word visually about what they have to offer.

Whether you have photos of your workspace, products or digital work, a PDF portfolio of your best Instagram shots is a super easy way to enhance your professional pitch and drum up some business. Here’s how.

1. Download Instagram Photos With DInstagram

The first thing to do is download your Instagram photos. DInstagram is a Chrome extension that allows you to download individual Instagram photos.  To do this:

a) Install the extension on Chrome.

b) Log into your Instagram account (this will also work if you aren’t logged in and are viewing your account’s photos, too).

c) Click on the photo you want to download.

d) In the upper right hand corner, click on the DInstagram Select your format (choose either PNG or JPG). Select the image size (Big, Medium, Small). Click on Download.

Downloading Instagram Image

e) Save the photos onto your computer. Tip: create a new single folder for all your photos for easy access.

2. Convert Your Instagram Photos To PDF

The next step is actually getting those photos into the PDF format. This is where Able2Extract 10 comes in handy.

a) Open Able2Extract 10.

b) Click on the Create icon in the toolbar.

Creating PDF In Able2Extract

c) Select your image files. Able2Extract 10 will let you quickly open a number of images simultaneously just by selecting multiple files at once. Click on Open.

Opening Images In Able2Extract

d) In each tab, click on Save.

Saving Images As PDF

Tip: Just as you did previously, create a new folder for all the PDFs you will be creating. This will give you a place to export any other future Instagram shots in PDF you may want to include when you update your portfolio.

3. Merge Your PDFs Into One

Now that you have all your image files saved as a PDF, you can start putting them together into one PDF file. You can continue on from Able2Extract. No need to exit the application. You can close off all but one of the tabs.

In that one tab you have left opened,

a) Click on the Edit icon from the toolbar. This is the file from which you will be creating your PDF portfolio. You can rename the file later on as needed; no need to worry about that just yet.

Editing PDFs In Able2Extract

b) Click on the Insert from PDF… option in the Editing panel. One by one, you can add your newly created PDFs to the file by selecting it and clicking on Open.

Inserting Pages Into PDF

In the pop up dialog, leave the value in both page fields to 1 (it will be the first and last page you insert). You can decide the order of your images by using the Before Page field:

Merging PDF Pages Together

c) Once all your PDF photos are inserted, click on the Save icon once again. Or as mentioned above, you can rename the file by going to File > Save As… and renaming your file.

Renaming PDF In Able2Extract

The final result? A professional looking PDF portfolio made from some of your best images:

Viewing PDF Portfolio In Able2Extract

You can repeat the above steps in this third section to get other PDF content into the portfolio for a complete look. Add a title page, PDF pages with company information, a section on your services, testimonials from clients or even add a page with a list of publications that have featured your products.

How effective your portfolio becomes is up to you, so show off your best stuff!

How To Analyze Open Data With Able2Extract, Power BI And DataHero

There is a general sense of helplessness when it comes to analyzing public data, especially as people think it involves insane amounts of statistical mastery and in-depth knowledge of complicated statistical software.

This is especially nerve wracking for data journalists, who are keen on using data to write stories that can actually influence a certain aspect of our society, such as healthcare or education. Truth be told, analyzing data and storytelling actually go hand in hand.

Since the Open Data initiative started, more and more data sets have seen the light of the day on various data-related portals. The most interesting data sets for journalists are the ones who are publicly available, simply because they are free to use and analyze. Those data sets are available on a variety of online sources, such as: www.data.gov, open.canada.ca, data.gov.uk and many more.

Open data portals contain thousands and thousands of data sets, related to various branches of government: education, business, economy, crime, justice, healthcare and more.

Once you start exploring the online data, you will see that it usually comes in 3 main formats: HTML, XML and PDF.

Common Open Dataset Formats

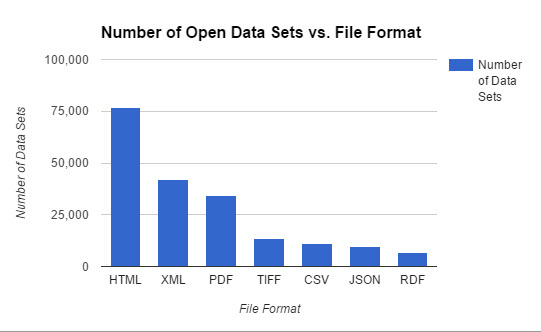
However, if you start investigating the data sets in more depth, you will quickly notice that there is only one format that’s present in almost every data set — the PDF. So, the logic goes that if you know how to analyze data that’s locked inside a PDF, you’ll know how to analyze any.

But what makes people want to store data in a non editable format?

First of all, when you save a data set as a PDF you are reducing its size, so it’s easier to store and upload to online databases. Secondly, since the PDF is not editable by default, you are making sure that no one tampers with your data and changes any of the ever-so-important numerical values. Remember, people spend countless hours gathering data and they are keen on protecting their hard work as much as possible.

So, once you find a PDF data set, where do you go next?

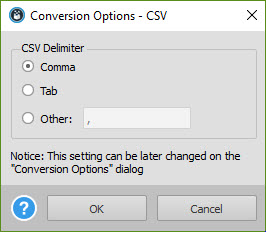
You now basically have only one option — you need to get that data into an Excel or CSV file format, while preserving source document accuracy as much as possible. After you do that, the next step would be to import that converted file into a data visualization tool of your choice, which we will cover later in this tutorial.

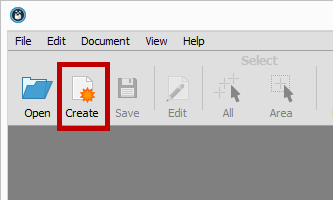
When it comes to exporting PDF data, the only tool in the market that has advanced enough PDF exporting capabilities is Able2Extract. That is because Able2Extract is not just a regular PDF converter. See, most (if not all) PDF converters on the market only convert PDF to Excel automatically, leaving you with a messy data set. The automatic conversion works good for one page invoices but converting a 1,000 page data set takes a lot more than that.

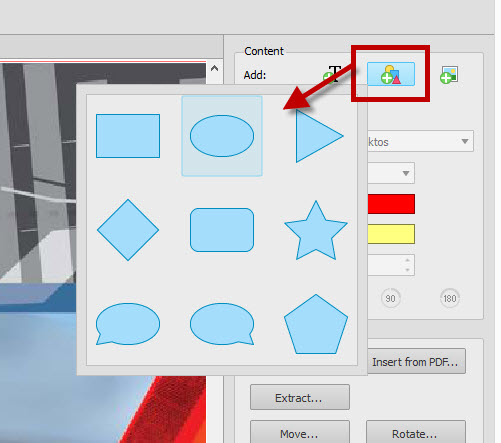
Able2Extract is the only converter that lets you fully customize your conversion by manually setting up row and column structure, prior to conversion. In addition it lets you preview the conversion results from within the software, which lets you export your data set as accurately as possible.

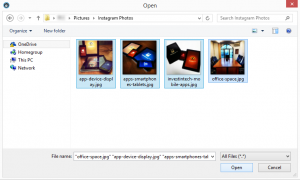
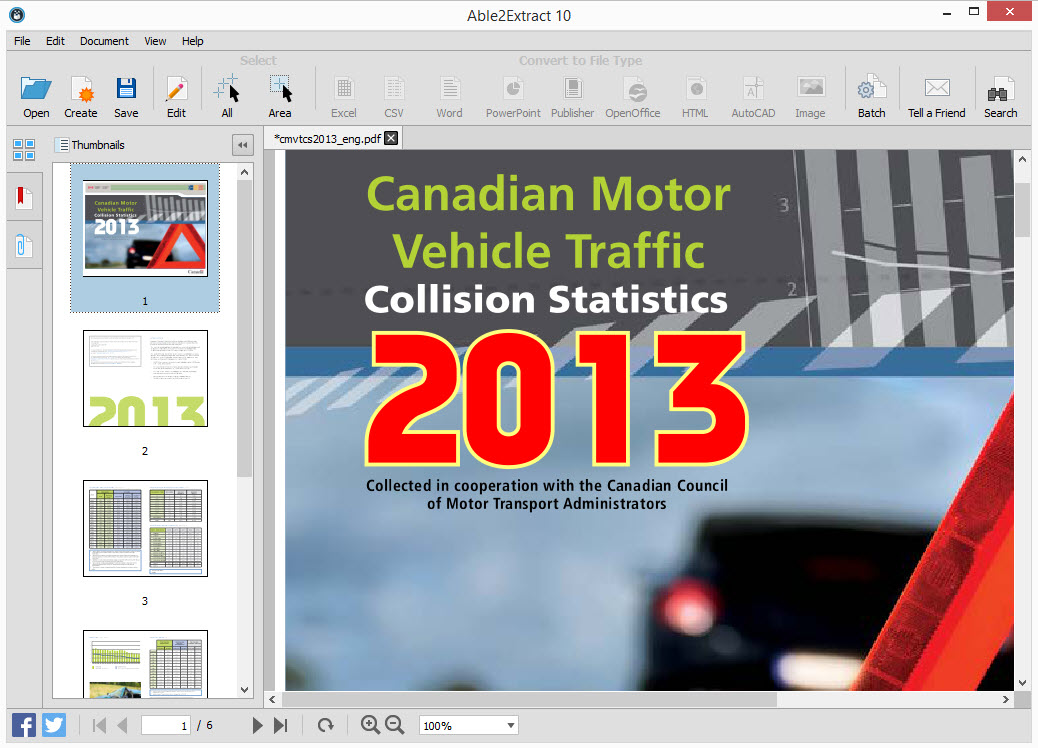
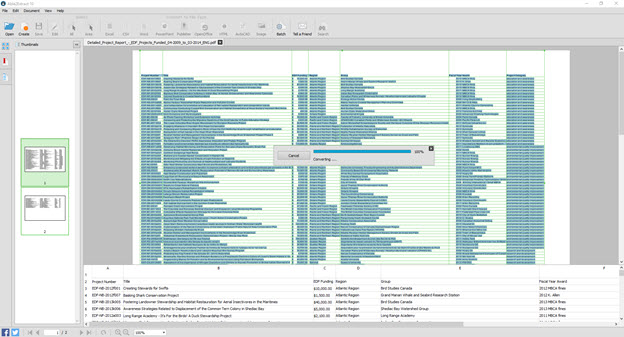
First, find your PDF data set. For this tutorial, we are going to use a practice data set containing all funded projects from Canadian Environmental Damages Fund. You can download it here.

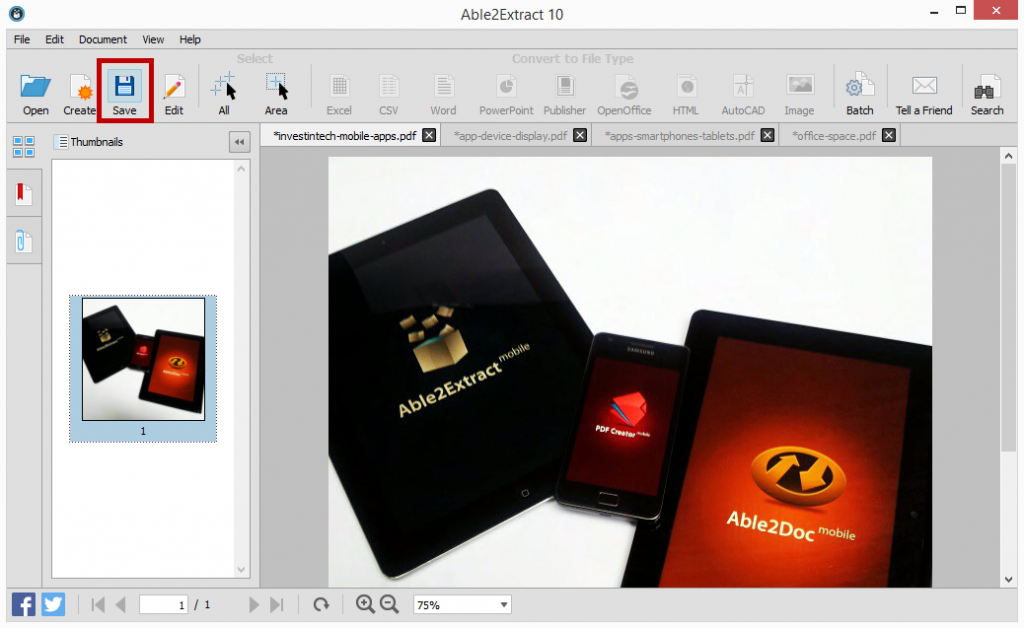
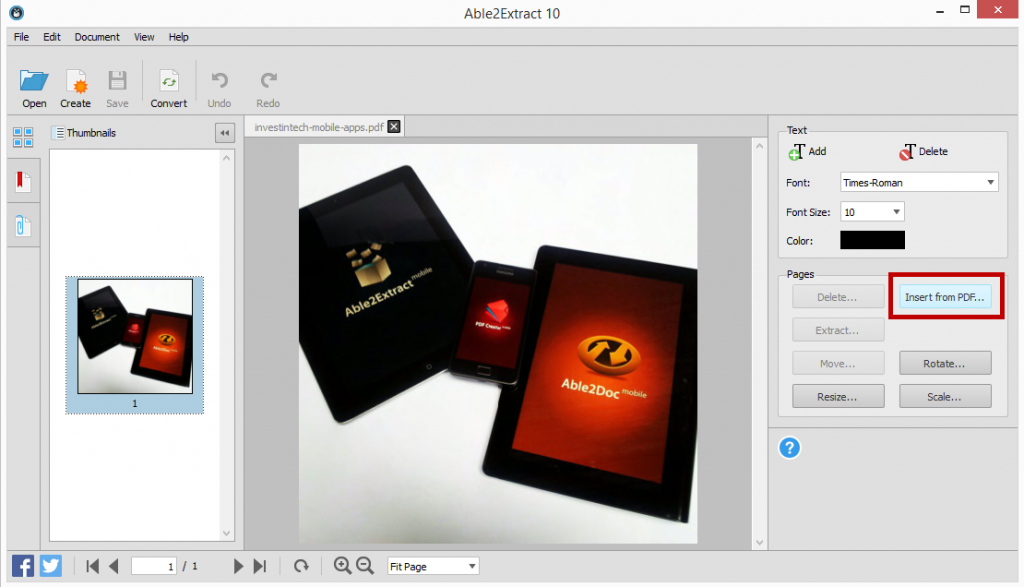
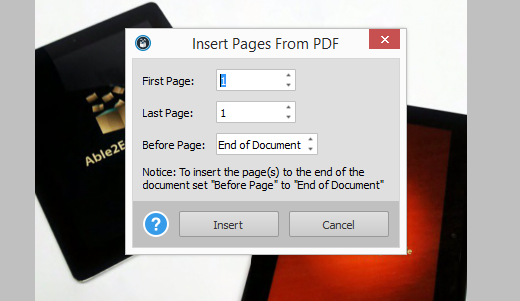
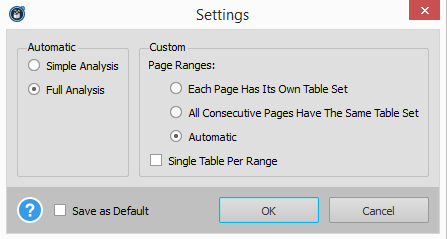
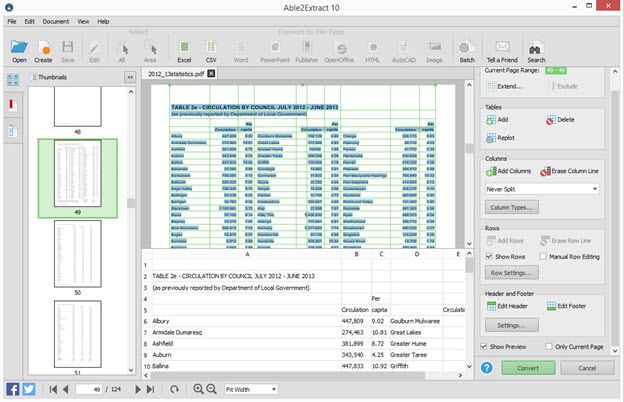
Open the data set in Able2Extract and use custom PDF to Excel conversion to convert it to an Excel file. Set up row and column structure using the right side panel and make sure to check the “Preview conversion” box. Once satisfied, hit the convert button to send the data to Excel.

Able2Extract Custom PDF to Excel

So, we got our data from PDF and into Excel. Great job!  

The next step is to go to Excel and clean the data. This will take 15 minutes to 2 hours, depending on the data set, but the thing you are looking for in the end is to end up with data in the tabular format, which means there is a separate row for each record. It should look something like this:

PDF to Excel Conversion Results

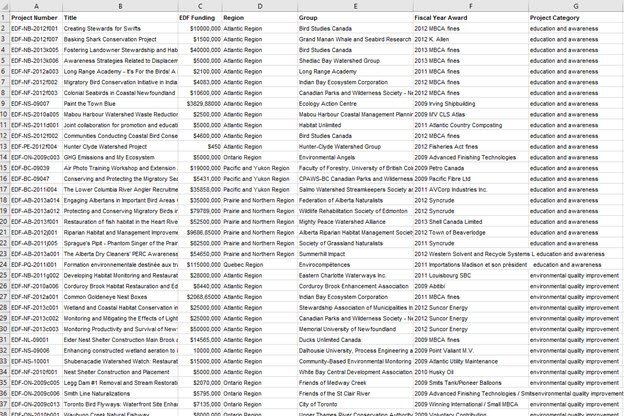
Make sure you don’t have any empty rows or blank cells and that all text is formatted in the same way. If there is a row with 3 cells missing it’s best to delete the whole row because it can mess up your end result and produce inaccurate results.

Now that we have a clean and tidy data set, it’s time to give life to these numbers and visualize them. Enter data visualization.

Data visualization simply means to create interesting charts from just plain data, which makes it easier to understand and present to your readers. When it comes to visualizing data you have an option between a desktop dataviz tool and a cloud dataviz tool. We will explore one example of both.

Our recommended desktop software for visualizing complex data is Power BI. We are recommending it because of its compatibility with Excel and the fact that it’s free to use for datasets up to 1 GB. You can download it here.

Before we start with Power BI, you will need to know that analyzing data starts by asking questions and then using data to answer them. For example, you can ask questions regarding our practice data set before we even upload it to the dataviz tool:

  • What was the EDF funding per region?
  • Which group received the biggest funding?

Depending on the data set, you can ask a 1000 questions and, make no mistake, you will get a 1000 answers. OK, let’s move on to more serious stuff. Power BI.

Power BI

Power BI is a Business Intelligence tool created for monitoring business performance and discovering market opportunities. Today we will use it as a data journalism tool in order to answer the two questions above.

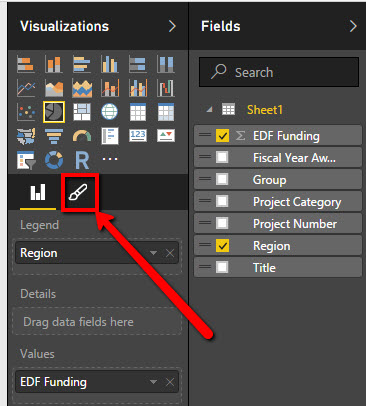
Once you open Power BI you first click on Get Data > Excel > Connect > Your file.

Choose a sheet where data is located and press Load. Alternatively, you can press Edit if you’d like to check your data set for mistakes once again.

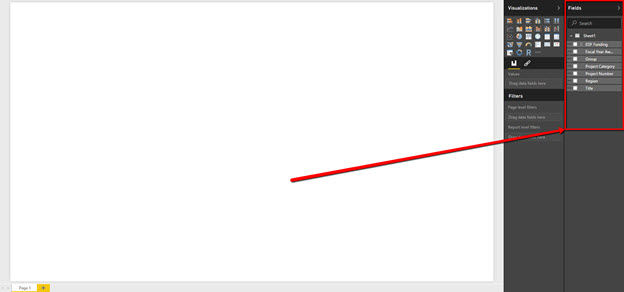
Once you do so, you will find a blank canvas and your data values on the right sidebar panel.

Accessing PowerBI Side Panel

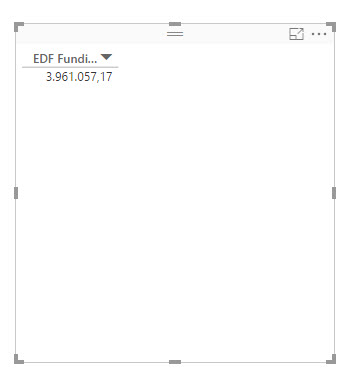
These are the values we are going to slice and dice. Let’s try to answer our first question. If you remember, we wanted to know what was the EDF funding per region.

The basic data field there is EDF Funding so we’ll drag it into the “Values” box. The canvas immediately changes and it is now showing us the total EDF funding:

PowerBI EDF Funding Values

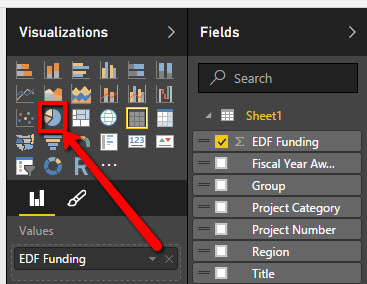
Let’s now introduce another data field. Select the “Pie chart”.

PowerBI Data Visualization Selection

Drag the “Region” field into the “Legend” box. Congrats, you made your first data visualization! We now have an overview of the funding per region and we can already start answering some questions.

EDF Funding Visualization By Region

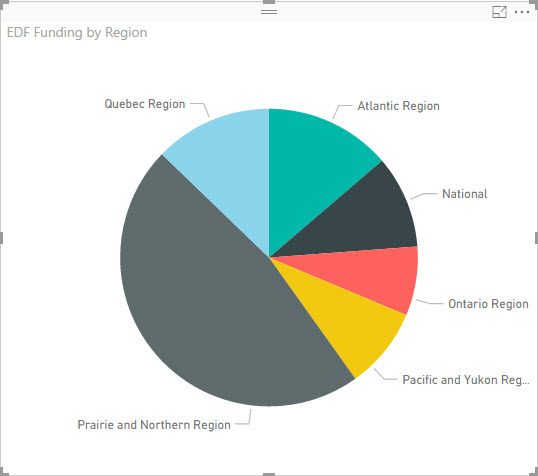
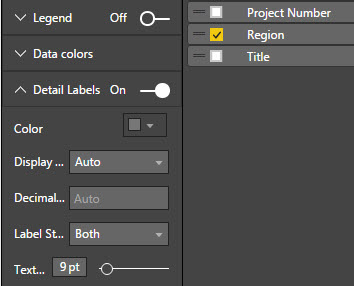
However, if you pay close attention you can see that we still don’t know the exact funding for each region. To show the exact values of data fields, go to “Format” panel:

Accessing PowerBI Fromat Panel

Expand the “Detail Labels” category, find the Label Style and select “Both” from the drop down menu.

Selecting PowerBI Detail Labels

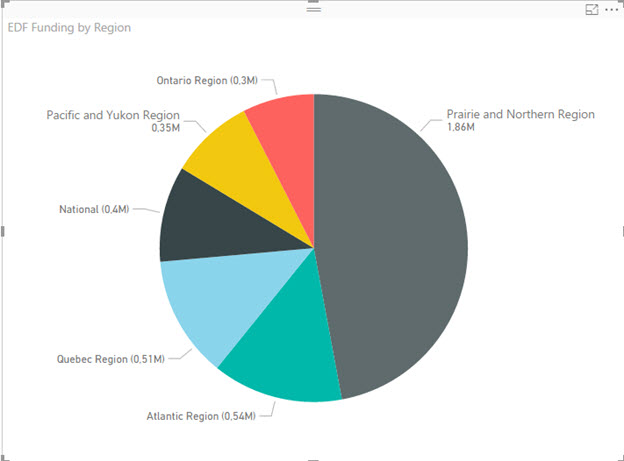
Our pie chart is now showing us the specific monetary values for each segment. Great, first question answered.

EDF Funding Pie Chart

OK, next up is to see which Group received the biggest funding. We’ll repeat the process but we’ll use a different chart, just to demonstrate different features of Power BI.

First, find and click on the Clustered Bar Chart.

Selecting Clustered Bar Chart

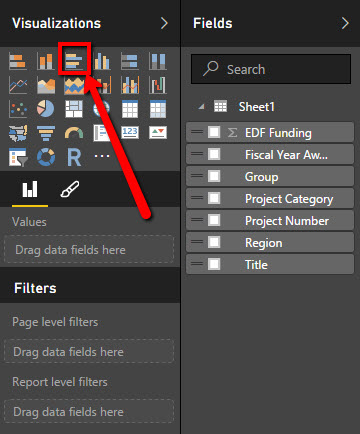
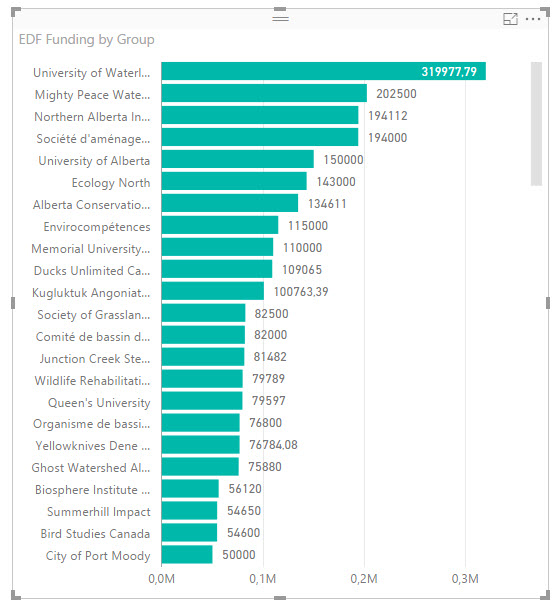
Drag the EDF Funding into the Values box and drag the Group into the Axis box. Turn on the data labels and you’ll quickly see that the University of Waterloo received the biggest funding — almost $320,000

EDF Group Values Chart

Now that you know how to ask questions and visualize public data, we will now quickly go over another tool that can help you visualize your data in the Cloud. Have in mind that the Cloud tools only support lower file sizes, which means you’re best off using them for 10-20 page data sets. Luckily, the data set from our example is actually pretty small.

DataHero

DataHero is a cloud solution for Business Intelligence and data visualization. It allows you to connect files from numerous online and offline sources and it even has an integrated data cleaning tool, which is nice, but I do not recommend relying solely on it.

You can use DataHero for free, for files up to 2 MB in size. Anything larger than that, and you’ll probably have to pay a monthly subscription which is between $60 and $90. For this purpose, we are going to use a free plan.

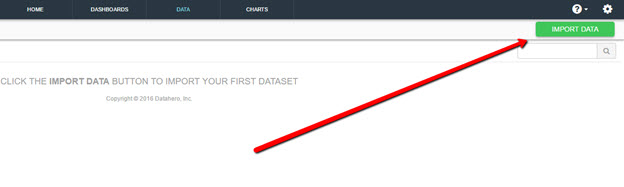
Create an account, click on the Data tab and click on Import Data.

Importing Data With DataHero

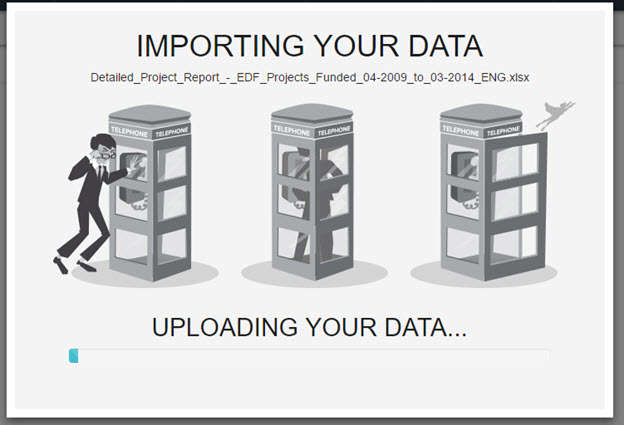
Find your Excel file, select the sheet and upload it:

Uploading Data with Datahero

On the next screen, check formatting and proceed.

What’s cool about DataHero is that it automatically suggests data visualizations:

Suggested Visualizations From DataHero

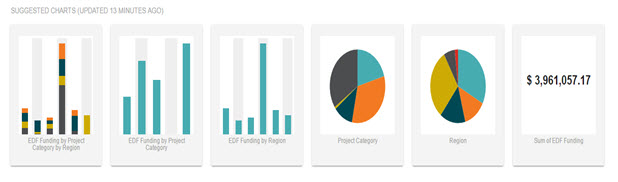
I was originally interested in EDF Funding by project category so I’ll just create a brand new chart. DataHero uses the same drag & drop interface so it’s really easy to start using it.

First, drag the EDF Funding field onto the canvas.

PowerBI EDF Funding Values

Next, drag & drop the Project Category field.

DataHero Pie Chart Visualization

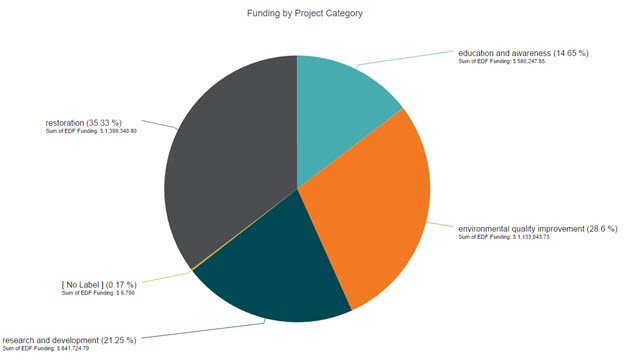
As you can see, we received our answer. Most of the funding money (35%) went into Restoration projects and the rest  was dispersed equally between other three categories.

There are other, more complex, data visualization tools but we will stick with DataHero and Power BI for the time being as they offer the most features in their free plans.

Let’s recap the entire process of analyzing public data that’s archived in PDF:

  1. Find a relevant data set
  2. Use Able2Extract’s Custom PDF to Excel feature  to convert it to Excel or CSV
  3. Clean the data in Excel and remove blank rows and cells
  4. Visualize the data using a tool like Power BI or DataHero

By now you should have a clear understanding of the entire process of analyzing public data and should be well on your way to using it to shape the future of journalism. The strategy is simple — just upload clean, high quality data and play around with it until you get what you are looking for.

Get Able2Extract 10.2 with Our Software Advantage Plan

As you may know, our Software Advantage Plan (SAP) is a premium customer support subscription package that comes with a number of perks.

From front of the line service to special discounts, the program makes sure that our customers are well-taken care of and given VIP treatment.

That’s why starting today, all SAP members have exclusive access to our new special build: Able2Extract 10.2!

This build is a small taste of what to expect from our next release, letting you try out new features way ahead of everybody else. Take a quick look at what Able2Extract 10.2 can do with your PDF files.

What Can You Do In Able2Extract 10.2?

On top of the editing features you already have, Able2Extract 10.2 gives you even more ways to modify your PDF content.

Add Bitmap Images

Able2Extract 10.2 will let you insert bitmap image formats directly into your PDF document. That’s right. You can add image formats, such as BMP, JPG, PNG, GIF (only the first frame will be inserted) and TIFF (only the first page will be inserted) to your content. And it’s as simple as clicking the Add Bitmap button, browsing for your image and clicking on Open.

Adding Bitmap Images PDF

Add Vector Shapes

This latest upgrade makes it easy for you to jazz up and add finishing touches your PDF content. You get the ability to add vector graphic shapes directly to your PDF pages. Just click on the Add Shape button and Able2Extract 10.2 will provide you with a selection of shapes to choose from.

Adding Vector Graphics PDF

Customize The Appearance Of Vector Shapes And Text

Because you can now add shapes to your content and could modify your text with different color, it only makes sense to let you customize your vector shape or text.

Able2Extract 10.2  comes with Outline with Color, Fill with Color and Line Width options, giving you the ability to modify the appearance of your text or vector shapes in detail.  By selecting a custom outline color, a fill color, and increasing the line width, you can give your content a visual boost with a few clicks.

Before:

Customizing PDF Content

After:

Customized PDF Content

Rotate Content Objects

Another editing option only available from Able2Extract 10.2 is the ability to rotate vector shapes, bitmap images and text. You can orient these content objects 90 degrees to the left or right, and even rotate them a complete 180 degrees as needed.

Convert AutoCAD Raster to Vector

And we didn’t stop at content editing. Able2Extract Professional 10.2 comes with a new Raster-to-Vector conversion engine for AutoCAD that allows you to convert scanned AutoCAD PDFs to vector drawings that can be edited.

Start taking advantage of Able2Extract 10.2. Existing members can simply log into their SAP account to access the build. And if you aren’t signed up yet, now’s the time.

Subscribe To Software Advantage Program

You can subscribe to the Software Advantage Plan online. The Software Advantage Program comes with premium support features that cover both Able2Extract Standard and Able2Extract Professional. For only $39.95 a year, you get:

  • Priority support via phone and email
  • Access to a personalized web portal
  • Free Access to all minor products updates and major upgrades
  • Exclusive access to new, unreleased product builds
  • Special volume discounts

Once we receive your order, you’re all set. You can start using your Software Advantage account immediately.

As a regular customer, you won’t be able to access any of these features until our next release. So join the program now and get in on Able2Extract 10.2!

How To Easily Optimize Your Business’ Books

Optimizing Business Books

Every business has to face at least one tricky challenge in common: to keep its books organized. That might seem like an easy task if you are an accountant or a bookkeeper, but that’s not always the case.

The vast majority of small business owners end up having to organize the financial/documental part of the business by themselves to save some money or just to keep a close eye on them. Organization is a crucial part for every business’ success, and here are some valuable ways to start improving your operations today.

The first action you can take to integrate and organize your company’s books is to digitalize every single piece of document you might have. That’s right, even that small parking receipt from two months ago or that hotel bill that you paid during the last conference you attended–digitalize it! Documents that are stored in digital format (e.g., PDF, Docx, XLS) are much easier to handle and to access, which can be a huge time-saver. Or if you want to customize and convert the format of the documents you are storing you can use simple and extremely efficient tools such as Able2Extract  to get the job done for you.

Also on the same line of digitalizing documents, a crucial measure to increase your books data security is to upload it to the cloud. This allows companies to store all the information they need in the cloud, which means that the data will be saved in external servers that can be accessed from anywhere at any time. Plus, some cloud service providers such as Welcome Networks presents the users with military-grade security for Virtual Desktops so they can have peace of mind about any hacking attempts.

Another highly necessary and important point to optimize books is to utilize online accounting software instead of the old fashioned offline desktop systems. Since these web-based applications allow you to send invoices, pay bills, do bank reconciliations, and to obtain reports of the most variables types, these web apps operate in the cloud and are the latest trend in the market.

An excellent example is SlickPie cloud accounting, a free software that even offers a source file attachment feature for companies to upload financial documents that are related to their transactions directly to their accounts, which can also be used in combination with Able2Extract to generate double the optimization value.

These software programs will drastically improve your business overall productivity since it will basically show you a financial x-ray of all your transactions through cash flow statements, balance sheets, and all other pertinent records registered in the system.  And the best part is – it will all be just one click away to be accessed from any desktop or mobile device.

All these solutions need to be integrated and applied to increase the effectiveness in the company’s books. This will strengthen the business with top trend tactics that are being used by the main players in every industry, and it will grant your company with advantage points over your competitors’ procedures.

By putting these practices into action, your company will save time, money, and it will be much more secure to provide any financial documents whenever they are needed, regardless of environmental conditions.

If you were still waiting for the right time to come to embrace digital innovations to fully optimize your company’s books, now is the time!

Get Ready For March Madness With Able2Extract 10

Basketball Slam Dunk

Microsoft Excel can be intimidating. True.  But a big pro is that it can be a life saver when wrestling with numbers and data.

Now, if you’re asking yourself when in the world would you have to deal with numbers and data, we have two words for you: March Madness.

March Madness 2016 is almost here and you can bet that everyone who doesn’t (or does) deal with data will be wading in conference standings and school stats over the next few weeks.

If you’re running a March Madness pool for your office, using MS Excel will be the best way to analyze, track and digest all the information you need to fill out your brackets and keep your pool in order.

Yet that’s only half the battle. The other half is getting that data into Excel. And this is where Able2Extact 10 can help you get everything in order.

Transfer Any March Madness Data To Excel

In Excel, you can streamline and combine any existing data you want to keep as reference or update as the tournament goes on.

Player and team data will usually be available in a downloadable PDF. But what if you have a Word file? A PowerPoint presentation? No worries.

You can get your March Madness data into Excel spreadsheets regardless of the format you have. Just open your file in Able2Extract 10 and select the content you want converted (a page, line or the entire file). Then simply click on the Convert to Excel command on toolbar.

Easily Convert Complex Team Information With A Few Settings

There are a lot of pain points associated with dealing with data when managing a pool—or several, one of them being the many different formats you have to consolidate and analyze. If you have differently formatted tables or statistical charts spanning pages, it can be a nightmare.

Good news is that you can tailor a PDF to Excel conversion according to the table structures in your file. Able2Extract has a few PDF to Excel conversion settings that make the job easier to identify and deal with the source document’s table structure. Select your settings before you make the conversion and you’re good to go.

Able2Extract Excel Conversion Settings

Customize Your Data Extractions Into Excel

You may also need specific data extractions for analyzing detailed statistics. For example, you may want to eliminate the data for lower seeded teams or scrape only the data from top teams in the last year to create your own shortlist.

For this, you can simply perform a Custom PDF to Excel conversion and filter out that information even before you even hit the Convert button. You can move rows, columns and even preview your conversion results to see if you have all the numbers you need in the right place.

Able2Extract Custom Conversion Interface

Convert March Madness Statistics In PDF to CSV

Which team you root for depends just as much on the numbers as it does on a team’s dynamics. But we’re talking about 68 Division I college teams plus stats on individual players, coaches and so on. That’s a lot of data!

It, thus, may be worthwhile to have database tools for March Madness. Or, if you’re tech savvy enough, you may have a tool or script that can crunch the numbers to predict the perfect March Madness bracket.

Able2Extract-CSV-Conversion-Option

In either case, you can get your March Madness PDF data into raw .CSV or delimited formats.  Just click on the Convert to CSV command in Able2Extract. It’ll get your data working with the databases and tools you already have in place.

Organize Your Data According To Worksheets

In some instances, you may have PDF data on teams all lumped into one single PDF with each team on one page or separate categories of data on each page.

It’s convenient for distributing and consuming the information, but hardly so if you want to separate that data. For instance, if you end up wanting to analyze each of the Final Four teams separately, you may want to organize and record each team’s information into separate worksheets.

Excel Single Worksheet Option

Now, you can go into your spreadsheet and move all your data around via copy-paste. But an easier way is to uncheck the Single Worksheet option in Able2Extract’s Excel/CSV Conversion Options before you make your conversion.

This will automatically convert each PDF page into a separate worksheet, saving you the hassle of doing it manually.

No matter what type of pool your group decides to set up, knowing your stats is essential. Whether it be analyzing wins, losses and odds or keeping track of results and pool entries, Excel will be your best bet. The key is getting that data set up properly for analysis. Hopefully a few of the tips above helped!

So with March Madness just around the corner, how are you filling out your brackets this year?