


Working with big datasets is never an easy task. Tons of spreadsheet data divided into rows and columns can be frustrating and stressful so anything to boost our productivity is more than welcome. And this is where companies like Google step in.
From time to time, Google releases a new update, becoming smarter and more practical than before. This happened just recently, when Google released an update for its spreadsheet application, Sheets, making it possible to visualize spreadsheet data even more easily than before.
If you haven’t explored this updated feature yet, here’s a closer look at how and why you should, especially if you work with data.
Explore In Sheets And Docs
Let’s back up a bit first. Last year, in September, Google added machine learning “Explore” feature (tucked into the bottom right hand corner of your Google Sheet/Doc) that gave you the possibility to ask any question about your data.
You could, in simple words, ask what you wanted to know and Explore would then analyze your data and present you with the answer. For example, when in a Google Sheet containing sales and pricing data on popular products, you could ask “What’s the average price for Fidget Spinner?” and Explore would give you an answer.
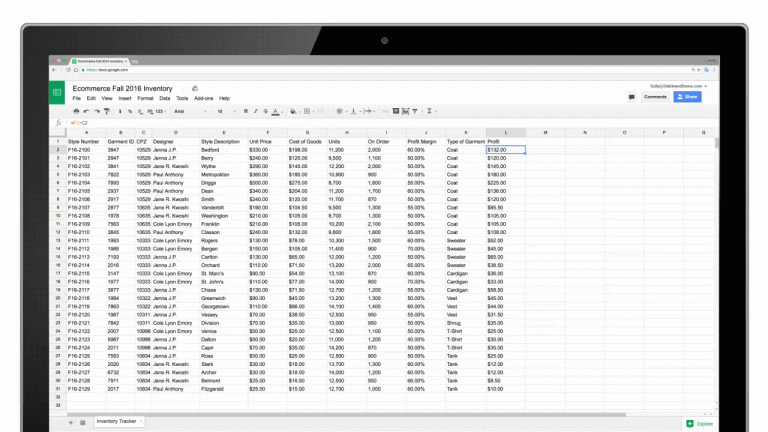
Image Source: Google
At the same time, researching and writing reports in Google Docs got a whole lot easier and quicker since you were able to get instant suggestions and tips based your content.
Image Source: Google
The feature could also recommend related topics, suitable images, valuable information and more correlated content for you to check out. But, that was last year.
Build Graphs In Google Sheets Based On Questions
Now, Google has gone one step further. The technology used in this new update is backed up by the same natural speaking language from last year. With this new update, Google Sheets can respond to specific questions and then create charts from your dataset. Explore could already build graphs, but not based on particular questions. Until now.
If you don’t see a graph visualizing the data and results you need, you can simply ask for it. There’s no need to build the visualization manually. You can just type in “Barchart for burger sales in May 2017,” for example, and Sheets will automatically generate the desired chart for you.
This is a huge time saver. It kills two birds with one stone: it automates the analysis of your data with a single question (versus number-sifting, sorting, and formulas) and then visualizes that specific analyses for you. You’ll spend less time on building data visualizations and use that time to improve existing datasets instead.
Business analysts, data journalists, finance strategists, marketers, sales professionals can easily put this to use as a quick tool to gain valuable insights.
As keeping your information up-to-date is critical for any business, Google lets you sync your data from Sheets to Google Docs and Slides with a single click of a button. Last year, you were already able to update charts. Well, now you can do that with tables, as well.
Just copy and paste the information you want from your Google Sheets and click the “update” button that will automatically sync all your data. This is an important feature because it can help people working on different documents to collaborate and access all the latest and relevant data.
Because Google is always on the lookout for new ways to improve your user experience, there are now more updates this year that will speed up your work:
- New Keyboard Shortcuts: You can change shortcuts in a way you find them most suitable for your work.
- New Print Interface: When you’re finished with your file, if you wish to print it, you can quickly adjust margins, play with scale or edit frozen rows and columns before actual printing.
- New Graph Editor: With the new and improved sidebar you can create, edit and do all sorts of customization on regular and 3D charts type.
- A Set of New Spreadsheet Functions: With more than 400 functions, you can now easily find whatever you are looking for.
Available for iPhones as well, this new update will definitely help you finish your work more efficiently. After all, with all these user-friendly features, you’ll love Google Sheets even more and use it more often than any other spreadsheet program.