


 We all use Microsoft Excel for different reasons. It’s a great tool for any basic or complex calculations because it’s so easy to adjust and edit your data. Besides this, there are several important features why someone would be using Excel on a daily basis:
- To visualize data — Excel charts are not perfect, but they serve a great purpose for visualizing information and numerical data.
- For checklists — It seems unusual, but people do use Excel to take notes, create tables and lists since it’s flexible, powerful and reliable.
- To deal with a large quantity of data — Pivot tables and data filtering is useful and can help when you wish to find any info on complex data sets. Also, Excel allows you to perform all sorts of tasks regarding quick data manipulation.
Excel is amazing, but it isn’t surprising that the data imported into Excel spreadsheets oftentimes comes from a PDF document. It isn’t rare to find bank statements, various legal documents, account reports, and other corporate and federal data locked in PDF, data that needs to be sifted through and analyzed in Pivot tables.
What Is A Pivot Table?
So what is a Pivot Table?, you ask.
Well, to start, a pivot table can be described as the ultimate summarizing tool in Excel. It helps you create reports and present results easily and precisely by using standard methods or pivot charts.
And why would you you need a pivot table? For a number of reasons. Sifting through data is one of those things you can’t do very well manually. Sure, you can do similar things with filters or combine multiple reports and check each one manually for changes, but they just don’t work as well or as efficiently as they should. Pivot tables can be set up in the way that refreshing the data will automatically update your entire report.
People have been split on whether or not creating a Pivot Table is difficult. Some say it is because pivot table functions aren’t mixed in with other Excel functions. Pivot table functions act as an independent data analytic tool, which have nothing to do with other Excel functions. So it requires working with data in a slightly different way.
Others say that a pivot table is similar to a hi-tech filter. If you’ve ever used any type of filter in a list before, you can certainly use a pivot table. The only difference is that Pivot tables actually do way more than any regular filters. But how do you get started?
How To Create A Pivot Table
If you want to create pivot tables in Excel from your PDF data, you first need to convert it into an Excel spreadsheet. Thankfully, there’s a tool that’s completely free, has no limitations of any kind and can convert any PDF file with 100% accuracy. The tool is called PDF to Excel online converter that can create an Excel file from your data hassle-free.
After you’ve successfully converted your PDF file, the tutorial below shows you how to easily create pivot tables in Excel and make your data analysis much more productive.
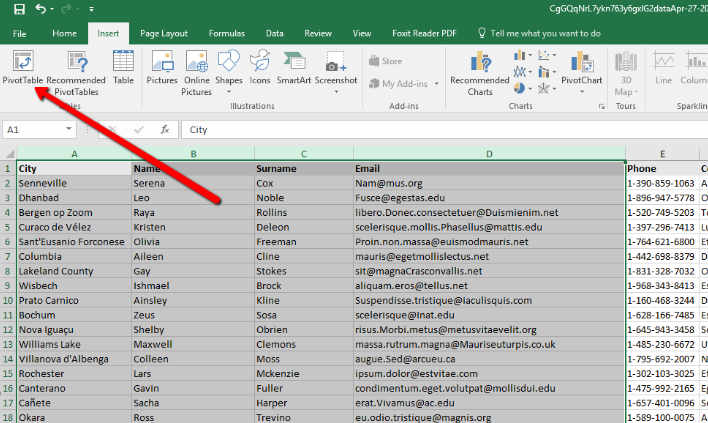
Step 1
In Excel, with your data open, highlight your desired cells and click on the Insert tab to access the Pivot Table button to open the dialog box.
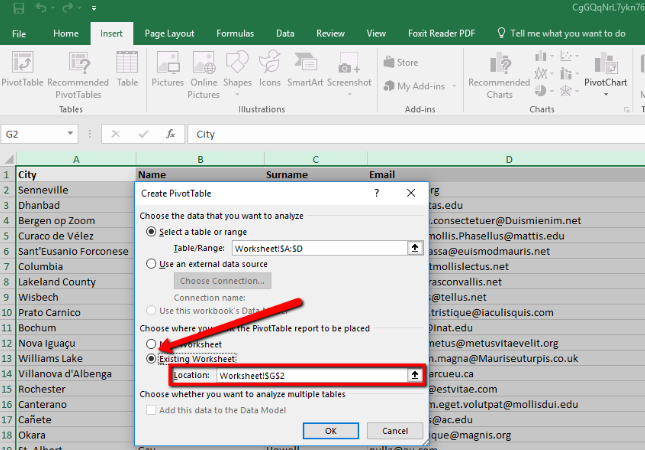
Step 2
Leave the preselected cells and, in the dialog, choose the Existing Worksheet for the location of your Pivot Table. Click on the Location line in the dialog box and click on a cell in the existing worksheet to enter as a reference.
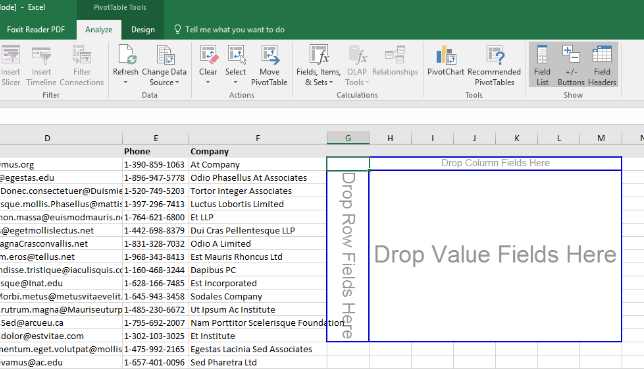
Step 3
Click the OK button, and a blank, new pivot table should appear in your worksheet.
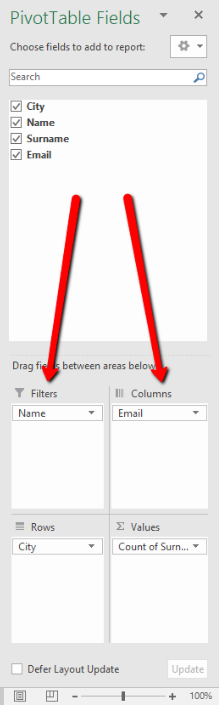
Step 4
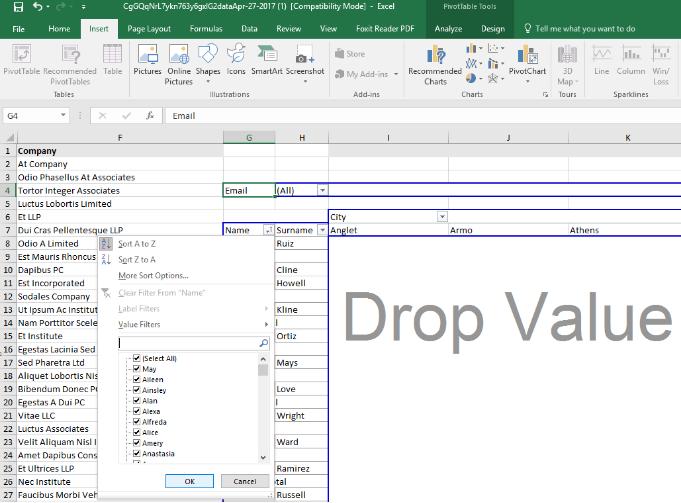
Insert your data by dragging the field names into the category fields listed below. As you add your information to these areas, your data will automatically be added to the pivot table.
Step 5
Note that you can always change the placement of your data or use filtering tools to modify the results shown by the tables.
A Few Pros And Cons To Know About Pivot Tables
In the end, we can conclude that pivot tables have both pros and cons.
They are quick to make, have built-in formulas, calculations, and charts that you can use easily. You can calculate a large range of metrics that can easily be segmented and they work with exported SQL datasets.
But on the other hand, they aren’t ideal for large datasets, with no ability to join to other tables. Pivot charts also don’t copy over very well. So if you’re planning on doing so, you’ll need to put some effort into it.
So try getting started with pivot tables using the above steps. Feel free to create and play with them and tell us about your experience with pivot tables in the comments.